
 English
 usheenthermal

Evaluating a Phase Change Thermal Interface Material Manufacturer for Projects
Date:2026-08-07
Pick the wrong phase change thermal interface material manufacturer and your hardware runs hot, fails early, and eats budgets.
IDC and Gartner report growing demand for validated thermal materials, favoring suppliers proven in real deployments.
Smart evaluation cuts risk, lowers junction temperatures, and keeps supply steady.
Reading Notes: Phase Change Thermal Interface Material Manufacturer Insights
→ Prioritize real-world thermal conductivity tests under curing conditions to ensure accurate heat dissipation.
→ Verify phase-change temperature and wettability for optimal surface contact and minimal thermal resistance.
→ Assess viscosity for your chosen application method—dispensing, screen printing, or pad—to guarantee uniform coverage.
→ Confirm dielectric strength and low volatile content via UL 746E and RoHS compliance for reliable insulation.
→ Review long-term stability through rigorous thermal cycling and cross-reference supplier qualification data to secure consistent performance.
5 Tests Every Tim Should Pass
A solid thermal interface material isn’t just about specs on paper. Real-world performance comes from how it behaves under stress, heat, and time—especially when sourced from a reliable phase change thermal interface material manufacturer.
Test 1: Thermal Conductivity Measurement Under Realistic Curing Conditions
Start with the basics, but don’t keep it basic.
Core checks:
- thermal conductivity under actual curing conditions
- impact of material thickness on heat transfer
- role of contact resistance in real assemblies
Sample prep
- Align surfaces to reduce thermal impedance
- Apply pressure similar to CPU/GPU mounting
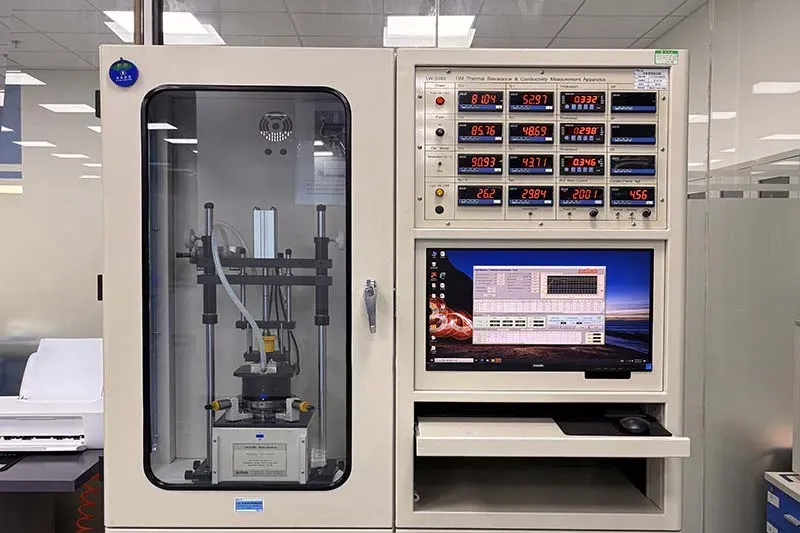
Measurement
- Use steady-state test method
- Track conductivity before and after curing
Validation
- Compare lab vs. field results
A dependable phase change thermal interface material manufacturer won’t just publish ideal numbers—they simulate real curing environments. Sheen Technology does this well, especially for power modules where curing shifts performance fast.
Test 2: Phase Change Temperature and Wettability Analysis
This is where a phase change thermal interface material manufacturer really proves its worth.
Key factors:
- phase change temperature vs device heat profile
- wettability and contact angle behavior
- surface energy alignment with substrates
Short breakdowns:
- Melting behavior matters. A mismatch between melting point and operating temps kills efficiency.
- Flow matters. Poor material flow leads to air gaps.
- Contact matters. Low contact angle improves spreading.
Table: Typical Performance Targets
| Property | Target Range | Impact | Test Condition | Risk if Poor |
| Phase change temp | 45–65°C | Activation timing | Controlled heating | Delayed conduction |
| Contact angle | <30° | Surface coverage | Copper interface | Air gaps |
| Surface energy | High | Adhesion | Polished plate | Poor bonding |
| Softening point | Stable | Repeatability | Cycle test | Pump-out |
| Wettability score | High | Uniformity | Visual + sensor | Hot spots |
A strong phase change thermal interface material manufacturer ensures consistency across batches, not just one perfect sample.
Test 3: Viscosity Assessment for Dispensing and Pad Application
Here’s where manufacturing gets real messy if ignored.
→ Flow must match process
→ viscosity shifts with shear rate
→ rheology defines repeatability
Step flow:
- Define application method:dispensing vs. pad application
- Measure under dynamic stress:simulate production speeds
- Adjust formulation:balance material flow and placement accuracy
Quick hits:
- Too thick? Bad spreading.
- Too thin? Overflow risk.
- Inconsistent? Production chaos.
A skilled phase change thermal interface material manufacturer tunes viscosity for both automation and manual handling.
Test 4: Dielectric Strength and Volatile Content Evaluation
This one quietly decides long-term safety.
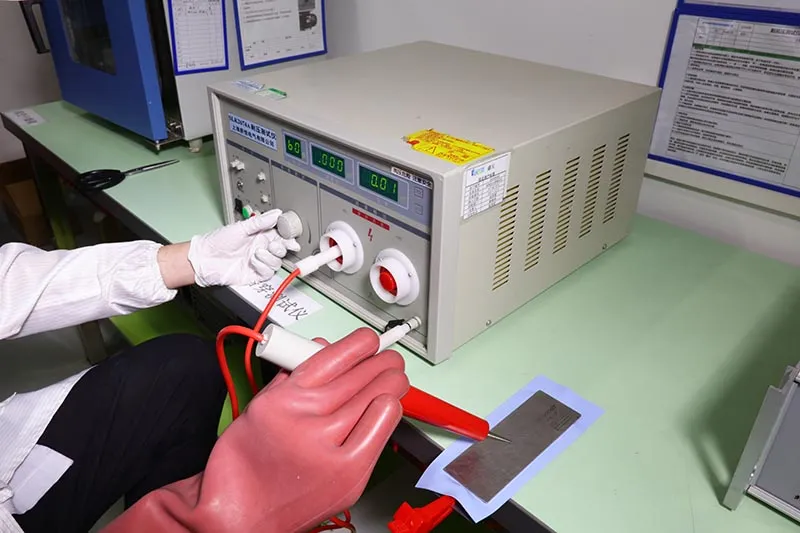
Electrical side:
- dielectric strength
- breakdown voltage
- stable electrical properties
Chemical side:
- volatile content
- outgassing
- material purity
Multi-layer check:
- Electrical insulation:test under rising voltage,confirm no early breakdown
- Thermal aging:monitor outgassing over time
- Contamination risk:ensure no residue affects circuits
Sheen Technology focuses heavily here, especially for telecom and automotive systems where failure isn’t an option. Any serious phase change thermal interface material manufacturer should.
Test 5: Long-Term Stability via Thermal Cycling and Cycle Testing
Performance today is easy. Performance after 1,000 cycles? That’s the real deal.
Nested evaluation:
Cycle setup
- temperature swings across temperature extremes
- controlled stress testing
Monitoring
- track material degradation
- measure performance retention
Outcomes
- stable = reliable
- drift = redesign
Short notes: Heat up. Cool down. Repeat.
Watch for cracking, pump-out, separation.
Sheen Technology SP205A-60 Reliability Test Report:

Test Condition:
| Test Item | Test Condition | Test Equipment |
| High Temperature Aging | 100℃, 1000 h | Precision Oven |
| Constant Temperature and Humidity | 85℃, 85%RH, 1000 h | Constant Temperature and Humidity Test Chamber |
| Thermal Shock | −20℃~80℃, 1000 h | Thermal Shock Test Chamber |
Acceptance Criterion:
| Performance Item | Original Value | Acceptance Criterion |
| Thermal Conductivity (W/(m⋅K)) | 6.07 | Tolerance ±30% |
| Thermal Resistance @10 psi (℃⋅in²/W) | 0.082 | Tolerance ±40% |
| Appearance | Flat surface with uniform color | Flat surface, uniform color, free of pinholes, brittle cracking and other defects |
High Temperature Aging Test Record Sheet:
| Test Item | Unit | 0 h | 200 h | 400 h | 600 h | 800 h | 1000 h | Change Rate | Judgement |
| Thermal Conductivity | W/(m⋅K) | 6.07 | 5.74 | 5.45 | 5.25 | 5.08 | 5.00 | −17.6% | Pass |
| Thermal Resistance @10 psi | ℃⋅in²/W | 0.082 | 0.084 | 0.089 | 0.095 | 0.102 | 0.107 | +30.5% | Pass |
| Appearance | Change Status | No change | No change | No change | No change | Slight overall yellowing | Slight overall yellowing | Slight overall yellowing | Pass |
Constant Temperature and Humidity Test Record Sheet:
| Test Item | Unit | 0 h | 200 h | 400 h | 600 h | 800 h | 1000 h | Change Rate | Judgement |
| Thermal Conductivity | W/(m⋅K) | 6.07 | 5.81 | 5.50 | 5.31 | 5.22 | 5.09 | −16.1% | Pass |
| Thermal Resistance @10 psi | ℃⋅in²/W | 0.082 | 0.090 | 0.094 | 0.098 | 0.101 | 0.105 | +28.0% | Pass |
| Appearance | Change Condition | No change | No change | No change | No change | Slight overall yellowing | Slight overall yellowing | Slight overall yellowing | Pass |
Cold and Thermal Shock Test Record Sheet:
| Test Item | Unit | 0 h | 200 h | 400 h | 600 h | 800 h | 1000 h | Change Rate | Judgement |
| Thermal Conductivity | W/(m⋅K) | 6.07 | 5.72 | 5.50 | 5.33 | 5.18 | 5.07 | −16.5% | Pass |
| Thermal Resistance @10 psi | ℃⋅in²/W | 0.082 | 0.086 | 0.092 | 0.099 | 0.105 | 0.110 | +34.1% | Pass |
| Appearance | Change Condition | No change | No change | No change | No change | Slight overall yellowing | Slight overall yellowing | Slight overall yellowing | Pass |
A reliable phase change thermal interface material manufacturer builds materials that survive years of abuse, not just lab demos. That’s where long-term trust comes from.
How Do You Verify Thermal Conductivity?
Getting thermal numbers that actually mean something can feel messy. For any phase change thermal interface material manufacturer, or even a smaller thermal interface material maker, clean verification ties lab data to real devices. From laser flash rigs to CPU-level checks, each method cross-checks the others so the final thermal conductivity value isn’t just nice on paper—it holds up in use.
Laser Flash Analysis on Composite Materials
Core flow:
- Sample prep for composite materials,control thickness, density, and surface finish
- Pulse via laser flash,capture temperature rise curve
- Data extraction,compute thermal diffusivity,combine with specific heat and density
Output mapping:
- thermal conductivity = diffusivity × specific heat × density
- supports full material characterization
A phase change thermal interface material manufacturer often leans on this because graphite flakes and ceramic fillers behave differently under heat pulses. Short bursts reveal how quickly heat spreads, not just how much.
In-situ Conductivity Testing with CPUs and Power Modules
1) Mount TIM between die and heatsink
2) Apply controlled heat flux
3) Track with embedded temperature sensors
4) Compare junction temps and device performance
Nested checks:
- CPUs vs power modules:steady load vs transient spikes
- Metrics:thermal resistance drop,stability over cycles
“Recent 2025 thermal management reports note that in-situ validation increasingly outweighs standalone lab metrics for electronics reliability.”
For any phase change thermal interface material manufacturer, this step exposes gaps between claimed and real thermal conductivity.
Cross-referencing Supplier Qualification Data
Data alignment:
- internal tests vs supplier qualification reports
- verify material specifications
Consistency tracking:
- batch-to-batch via test reports
- compliance with industry standards
Quality loop: flag drift → adjust sourcing → enforce quality assurance
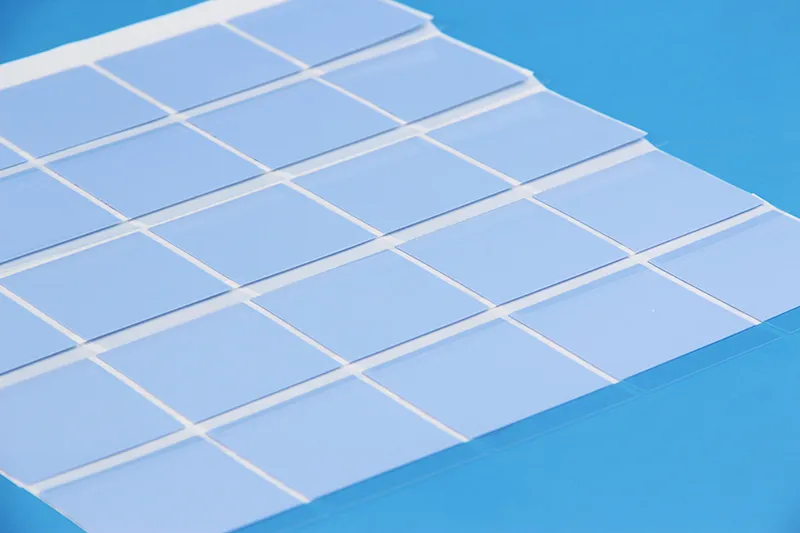
Sheen Technology Phase Change thermal pad performance properties:
| Properties | Color | Reinforcement Carrier | Thermal Conductivity | Thermal Impedance (@50psi) | Thickness | Phase Change Temp. |
| Unit | - | - | W/m·K | ℃*in2/W | mm | ℃ |
| SP205A-30 | Gray | - | 3.0 | 0.05 | 0.2 | 45 ~ 55 |
| SP205A-35 | Gray | - | 3.5 | 0.04 | 0.2 | 45 ~ 55 |
| SP205A-40 | Gray | - | 4.0 | 0.03 | 0.2 | 45 ~ 55 |
| SP205A-50 | Gray | - | 5.0 | 0.02 | 0.3 | 45 ~ 55 |
| SP205A-60 | Gray | - | 6.0 | 0.015 | 0.3 | 45 ~ 55 |
| SP205A-AL-40 | Green/Gray | Aluminum Foil | 4.0 | 0.06 | 0.18 | 50 ~ 60 |
| SP350P | Green | Polyimide | 1.8 | 0.4 (30psi) | 0.13 ~ 0.5 | 45 ~ 55 |
| Test Method | Visual | - | ASTM D5470 | ASTM D5470 | ASTM D751 | ASTM D3418 |
Multiple short checks keep a phase change thermal interface material manufacturer honest, while a broader thermal interface material supplier view ensures long-term thermal performance stays consistent.
Need phase change temperature ranges, thermal conductivity under curing, dielectric strength, viscosity profiles, and long-term cycling data before selecting a phase change thermal interface material? Download the product datasheets to compare PCM, thermal grease, and gap filler options for data center, telecom, and industrial power applications.
Certificates And Standards For Tim Suppliers
Staying legit in the thermal game isn’t just about performance—it’s about proof. If you’re sourcing from a phase change thermal interface material manufacturer, certifications tell you who’s actually doing things right. From quality systems to thermal testing, these standards keep suppliers like Sheen Technology consistent, safe, and ready for real-world demand.
ISO 9001 and Supply Chain Management Compliance
Working with a phase change thermal interface material manufacturer means trusting their ISO 9001 setup isn’t just paperwork fluff. It shapes the entire quality management system, from sourcing raw silicone blends to final shipment.
Core checkpoints include:
- Supplier evaluation tied to traceability
- Tight process control during batch production
- Ongoing quality assurance audits
1) Incoming materials verified
2) Production monitored in real time
3) Final inspection logged for compliance
“Suppliers with mature ISO 9001 systems show up to 35% fewer quality deviations in electronics materials supply chains.” — 2025 global manufacturing report
For buyers hunting a reliable phase change TIM manufacturer, this standard quietly does the heavy lifting.
UL 746E for Dielectric Strength Certification
Electrical safety isn’t negotiable. UL 746E checks dielectric strength and long-term electrical insulation behavior under stress.
Key outcomes:
- Verified electrical properties
- Stable electrical performance in high voltage modules
- Certified material testing benchmarks
Short bursts of voltage. Long exposure cycles. Both matter. A phase change thermal interface material supplier like Sheen Technology aligns these tests with real device conditions—IGBTs, ASICs, the works.
RoHS Limits on Volatile Content and Material Composition
Nobody wants hidden toxins in their thermal stack. RoHS rules cap hazardous substances and track volatile content in binders and fillers.
Multiple checkpoints keep things clean:
- Chemical scans confirm material composition
- Thresholds enforce substance limits
- Documentation supports environmental compliance
For any phase change thermal interface material manufacturer, this isn’t optional—it’s market entry basics.
ASTM D5470 Thermal Resistance Standard
Thermal claims mean nothing without ASTM D5470. This standard test method defines how thermal resistance and thermal conductivity are actually measured.
Nested testing flow:
Sample prep
- Controlled thickness
- Surface conditioning
Measurement phase
- Heat flux applied
- ΔT recorded
Output
- Verified thermal performance
- Comparable material characterization
Quick takeaway: if a phase change TIM manufacturer can’t show D5470 data, you’re guessing. Sheen Technology uses it to keep comparisons honest across pads, gels, and phase change blends.
Data Centers: Why Phase-Change Tim Matters
Data centers run hot, fast, and nonstop, so keeping chips cool isn’t optional—it’s survival. A smart pick like a phase change thermal interface material manufacturer helps push thermal management forward while keeping performance steady and power bills in check.
Optimizing Heat Dissipation in High-Performance Computing
In high-performance computing, heat piles up fast. A trusted phase change thermal interface material manufacturer improves heat dissipation by reducing thermal resistance at the chip interface.
- Better contact → smoother heat flow
- Lower hotspots → stronger system performance
- Stable temps → improved computational efficiency
Steps that matter in real deployments:
- Surface warms → material softens
- Gaps fill → air pockets vanish
- Heat spreads → cooling systems work less
Nested view:
Interface layer
- Phase-change compound
- Boosts cooling solutions efficiency
- Keeps chips within safe limits
Sheen Technology keeps designs tight and consistent, which matters when racks are packed.
Lowering Junction Temperature for ASICs and GPUs
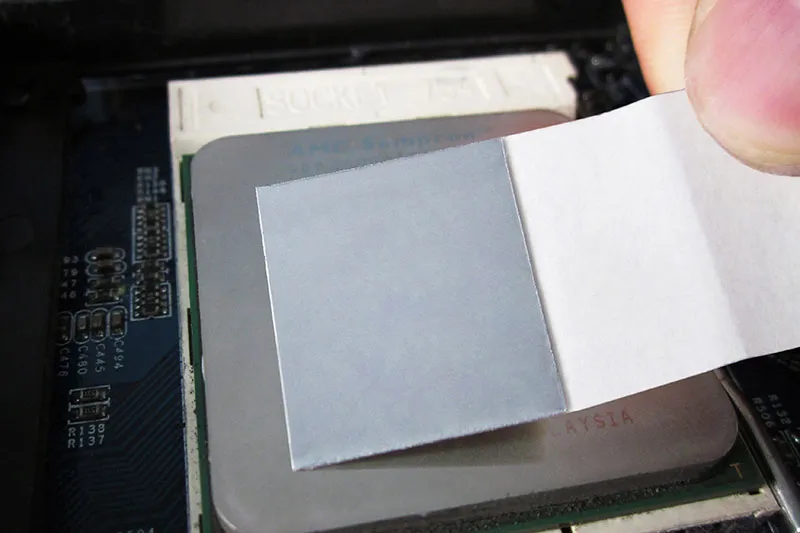
For ASICs and GPUs, even small drops in junction temperature can shift outcomes.
- Short bursts: improved chip performance
- Long runs: stronger device reliability
A reliable phase change TIM supplier focuses on thermal conductivity and consistency. Sheen Technology aligns material behavior with real workload spikes, helping semiconductor devices stay efficient without sudden throttling.
Boosting Power Density Handling in Telecommunications Infrastructure
As power density rises in telecommunications infrastructure, heat flux becomes intense. A capable phase change thermal interface material manufacturer supports compact network equipment without sacrificing system uptime.
| Scenario | Heat Flux (W/cm²) | TIM Type | Resulting Thermal Capacity |
| Base load | 5 | Standard TIM | Moderate |
| Mid load | 10 | Phase-change TIM | High |
| Peak load | 15 | Optimized PCM | Very High |
| Burst load | 20 | Advanced PCM | Stable |
- Outcome: stronger thermal management solutions
- Impact: fewer thermal shutdowns
Ensuring Long-Term Stability through Rigorous Cycle Testing
Daily heating and cooling push materials hard. Without proper cycle testing, material degradation creeps in.
Multi-layer reliability flow:
- Repeated thermal cycling
- Check thermal fatigue
- Measure performance durability
- Predict product lifespan
Sheen Technology validates stability under stress, helping maintain long-term stability even after thousands of cycles.
【Request a Custom Quote】Not sure which phase change thermal interface material fits your project profile? Send us your operating temperature window, power density, interface gap, application method (dispensing, screen printing, or pad), and reliability targets, and our engineers can recommend the right PCM solution for your design.
Sheen Thermal
Dongguan Sheen Electronic Technology Co., Ltd · Founded in 2008
Manufacturer of thermal interface materials and silicone foam for automotive electronics, energy storage, power electronics, communications and consumer electronics.
Certified
- ISO 9001:2015
- ISO 14001:2015
- IATF 16949:2016
What we supply
- Thermal conductivity Up to 90 W/m·K
- Thickness 0.3–10.0 mm
- Custom & samples Die-cut to drawing, 3–7 days